200 million tonnes of Scope 3 opportunities, mapped
Carbon3's AI agents mapped 1,694 insetting opportunities across 364 companies and 1,500 value-chain partners.
By Carbon3 team1 min read
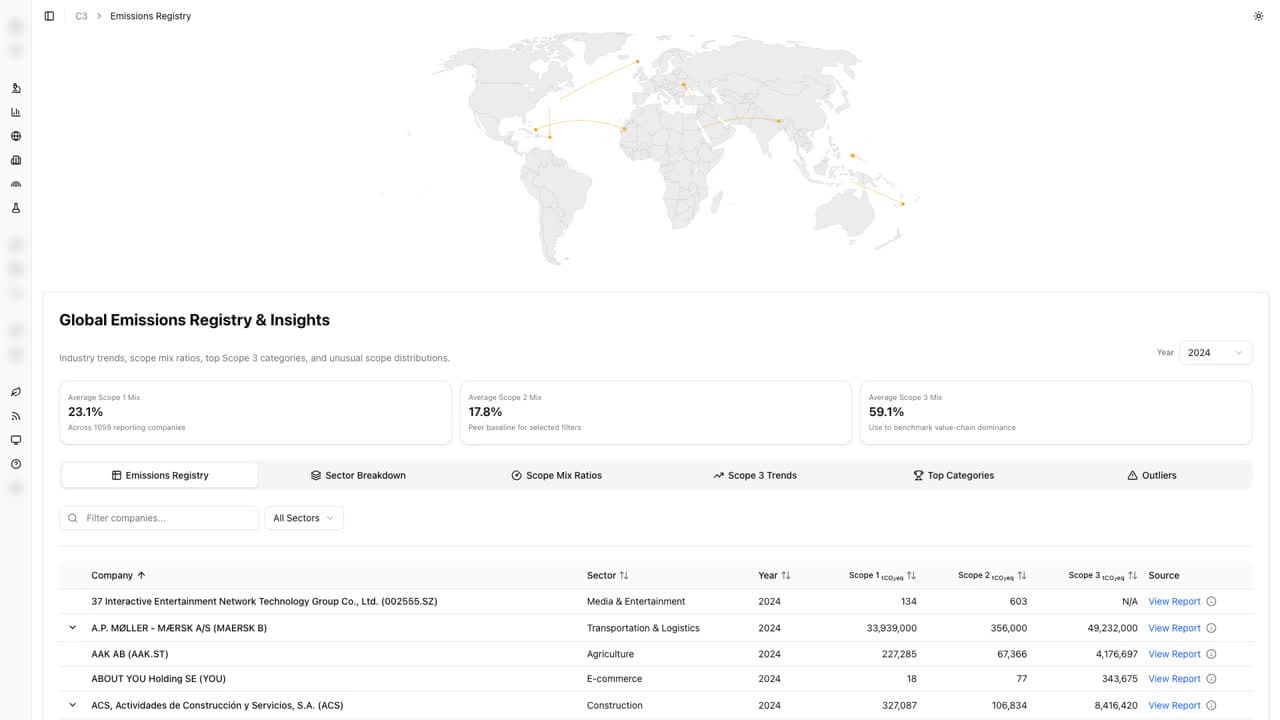
Across the 1,059 companies in our Emissions Registry, Scope 3 averages 59% of the corporate footprint. Yet almost nobody can see where the value-chain opportunities actually sit. So we built a tool that shows you.
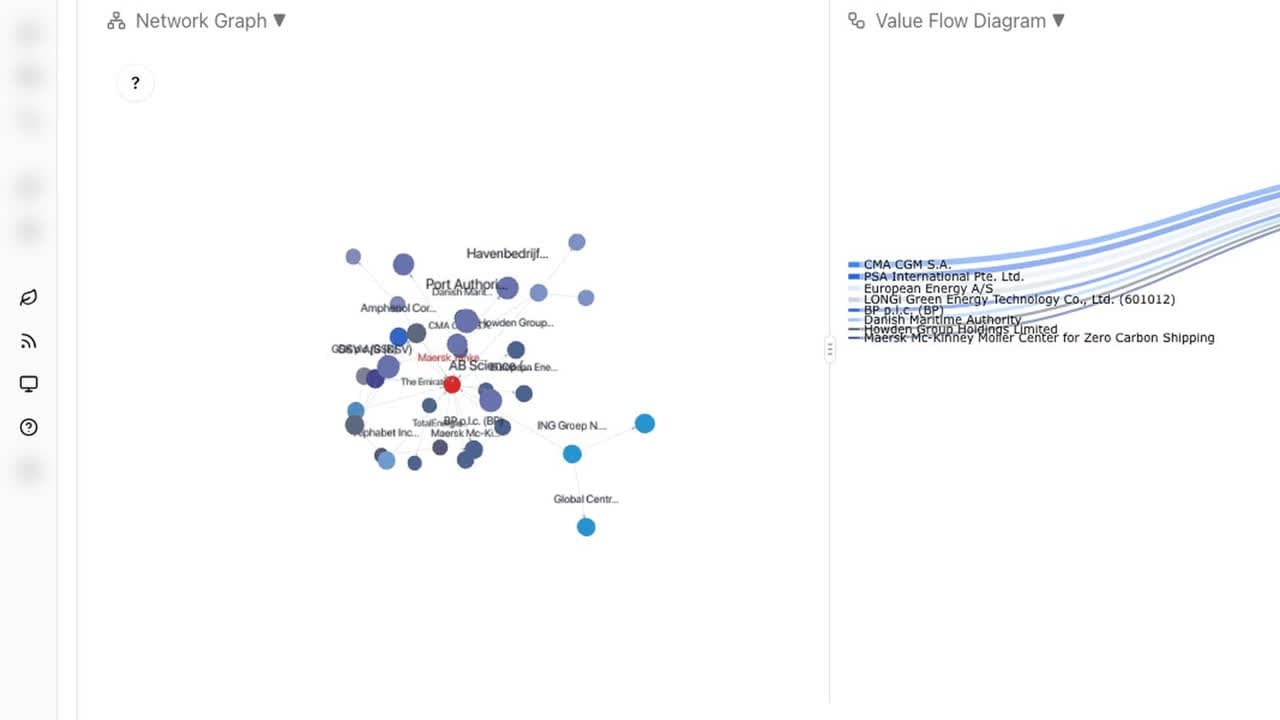
Carbon3's AI agents have mapped 1,694 insetting opportunities across 364 companies and over 1,500 value-chain partners, each with estimated GHG impact, project revenue, and insetting revenue. Combined potential: roughly 200M tCO₂e in annual reductions and $25B in project value.
- A green hydrogen industrial ecosystem at Suez: est. 3.2M tCO₂e and $200M
- A Southwest Airlines fleet efficiency program: est. 3.15M tCO₂e
- Green steel supply chains for automotive: est. $200M with H2 Green Steel
- Offshore wind co-financing through banking portfolios: est. 1M tCO₂e
The next decade of decarbonization won't be won inside company walls. It will be negotiated, financed, and built between them. And every partner is a doorway into their own network.
Free to explore, no login: carbon3.net/data/companies
Originally published on LinkedIn, 17 July 2026.
The Carbon3 Newsletter
Weekly analysis of industrial decarbonization and insetting across Scope 1 to 3, from the Carbon3 team.
Read more from the research team.
Product
An open emissions registry for Scope 1, 2 and 3 data
Corporate disclosures used to sit buried in thousands of PDFs.
Read the articleProduct
We built a global insetting market and simulated it end to end
Supply-chain decarbonization is a financing problem.
Read the articleField notes
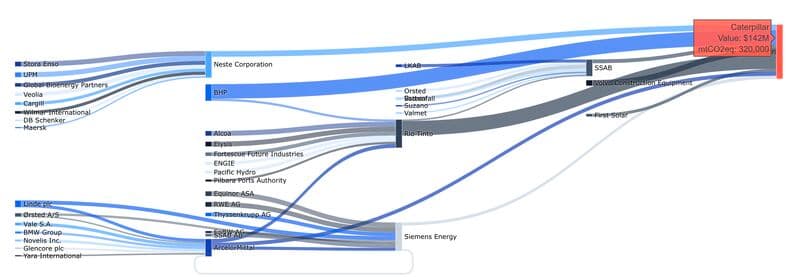
Caterpillar: $302 million and 1.57 million tonnes across the value chain
Supplier solar and storage, renewable diesel, hydrogen steel and electrified mining fleets with its key Scope 3 partners.
Read the article
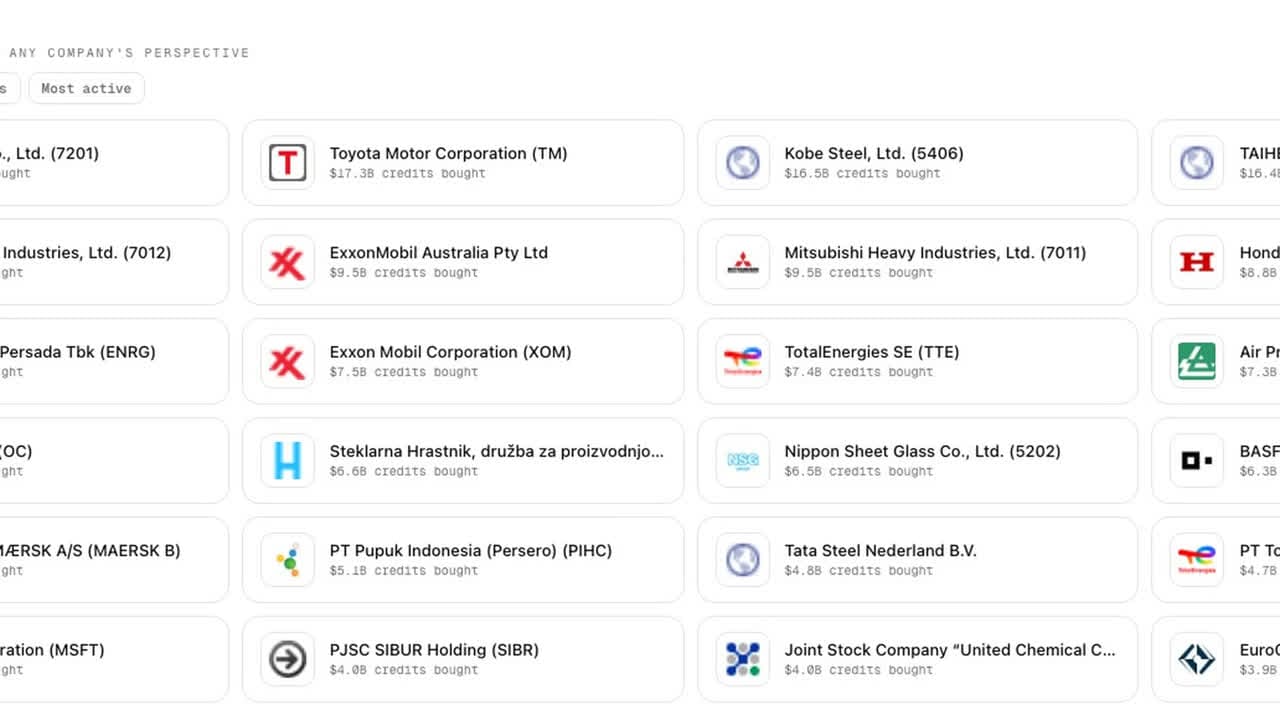
See the companies behind these figures in the Data Hub.
Look up your suppliers’ emissions and targets, free.