What the data shows about the Scope 3 market
Across 1,248 registry companies, 558 projects and 1,065 opportunities, only 127 firms appear to be moving from exploration into execution.
By Carbon3 team2 min read
Most Scope 3 discussions still focus on inventories, reporting, and target-setting. We wanted to look at a different question: when you line up public emissions data, decarbonization projects, and research activity together, what does the market actually look like?
At Carbon3, we have been building and analyzing a public dataset that combines corporate emissions disclosures, emerging decarbonization projects, and visible research or opportunity pipelines. In our latest pass, that meant looking across 1,248 registry companies, 558 emerging projects, and 1,065 research opportunities.
A few things stood out.
-Research activity clusters heavily in supply chain / procurement, clean power, fleet/EV, and hydrogen/ammonia.
-Execution activity clusters in a similar set of themes, especially fleet/EV, shipping/maritime, clean power, and hydrogen.
-The pipeline is large, but still early. 309 projects are marked “Under Development,” while only 15 are “Completed.”
-And only 127 companies appear in both the research and emerging-project datasets. That is a surprisingly small cohort of firms that seem to be moving from exploration into real execution.
What this suggests to us is that Scope 3 decarbonization is shaped by relationships, concentration, and position within a wider ecosystem. Some companies matter because they carry very large emissions exposure. Others matter because they sit in places where activity, partnerships, and implementation pathways connect.
That has major implications for how companies think about action. It suggests that progress may depend not only on finding good projects, but also on understanding where influence sits inside supply chains and how decarbonization value can move across them.
That is a major part of what Carbon3 is trying to understand and support through insetting.
We're curious how others are thinking about this: when you look at Scope 3, do you see the bigger bottleneck as project supply, buyer demand, or the difficulty of connecting the right actors across the chain?
Originally published on LinkedIn, 30 March 2026.
The Carbon3 Newsletter
Weekly analysis of industrial decarbonization and insetting across Scope 1 to 3, from the Carbon3 team.
Read more from the research team.
Product
Sustainability Opportunity Insights by Carbon3's AI
Enter a company's name and reveal its emissions profile, targets, supply-chain opportunities, investment needs and risks.
Read the articleProduct
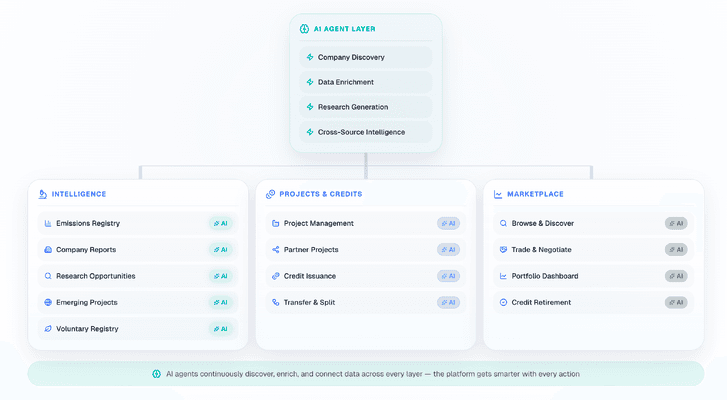
How we leverage AI agents at Carbon3
How Carbon3 builds the financial infrastructure for supply-chain decarbonization, and why AI is not a bolt-on feature.
Read the articleTransition finance
Six opportunities for sustainable finance, and the gap beneath them
WRI's 2026 list is right about the institutional constraints.
Read the article
See the companies behind these figures in the Data Hub.
Look up your suppliers’ emissions and targets, free.