Half of the companies checked are reducing emissions at the pace their climate targets promise
Carbon3 compared about 7,200 companies on the SBTi registry three ways: how many have climate targets, how fast those targets promise to cut and whether reported emissions are falling that fast.
By Carbon3 team6 min read
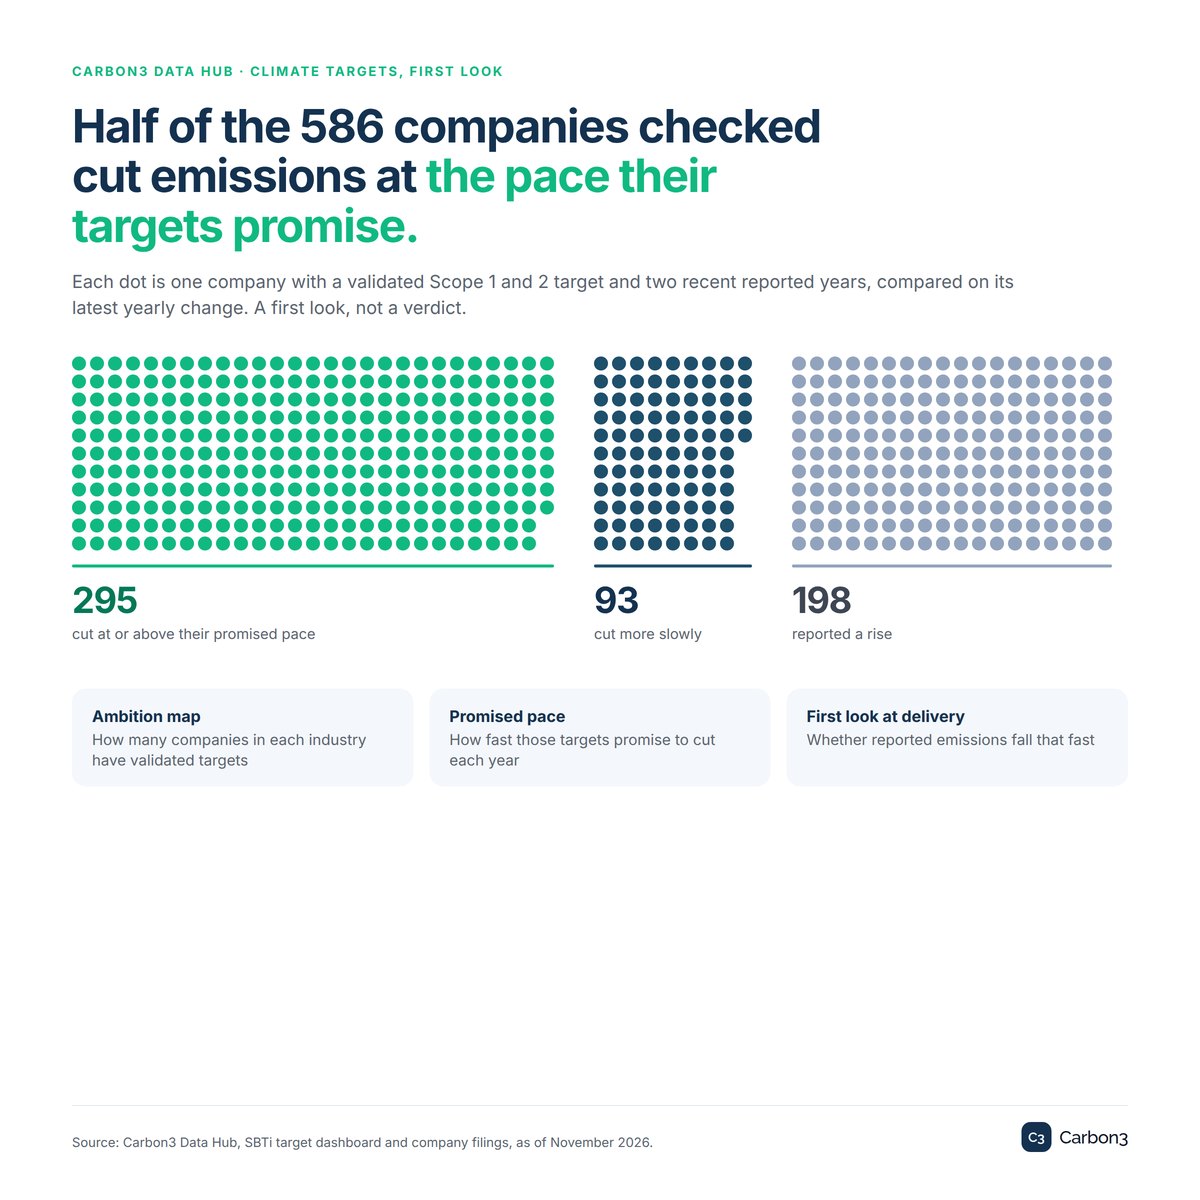
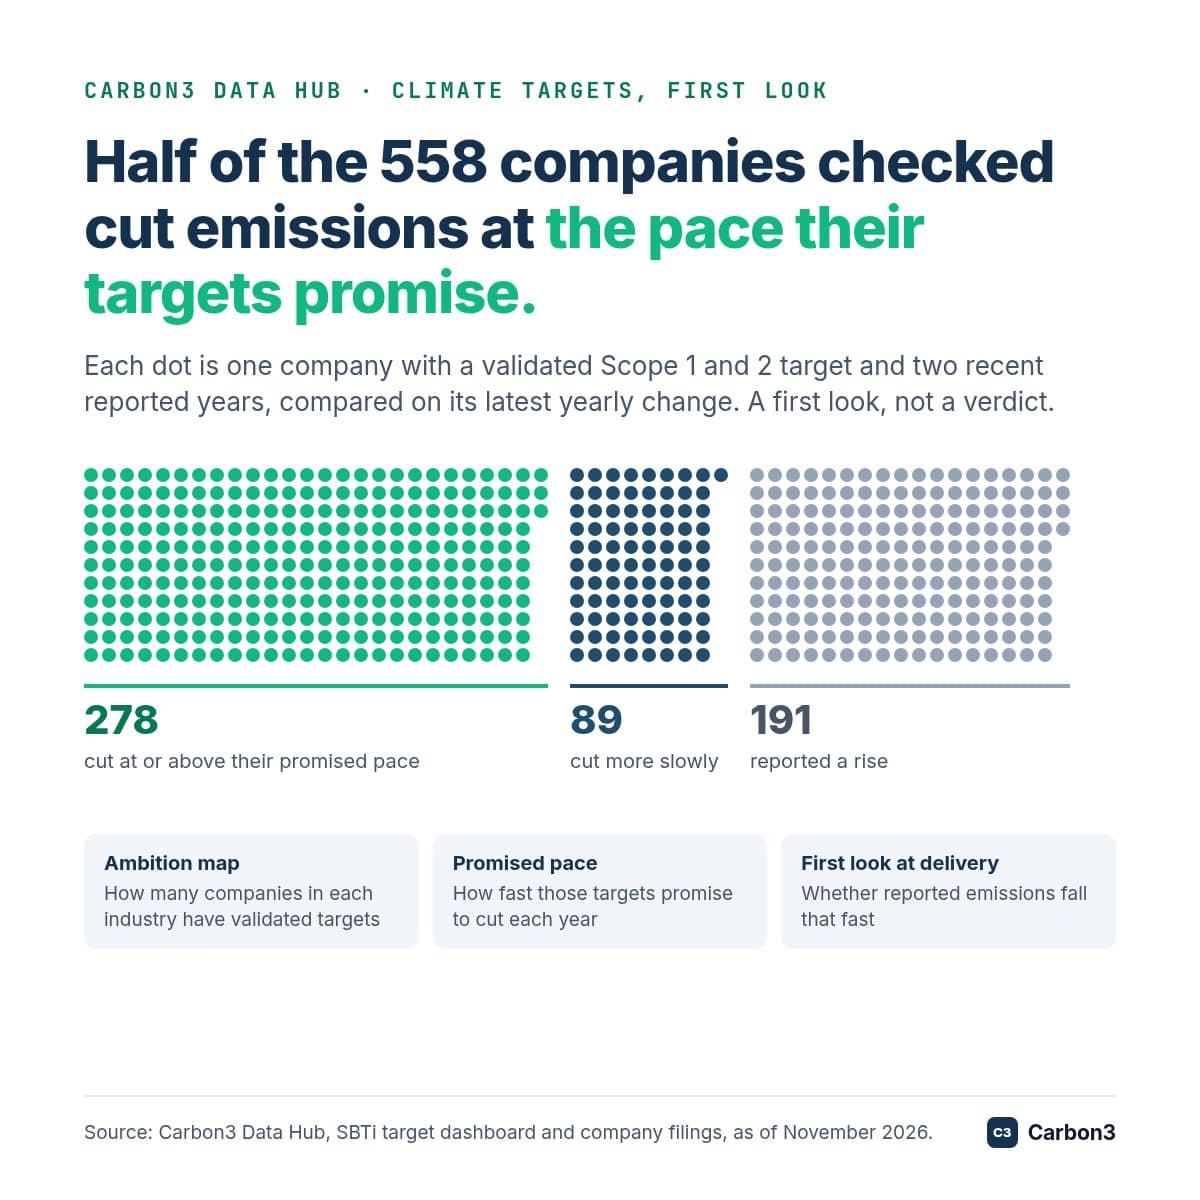
Carbon3 has set corporate climate targets beside the emissions that companies later report. Of 586 companies with a readable target and two recent years of reported emissions, 295 reduced their emissions at least as fast as their target needs, 93 cut more slowly and 198 reported a rise. Half are on pace. It is a first look rather than a verdict, but it moves the conversation about corporate targets from what companies promise to what they deliver.
The study is live in the Carbon3 Data Hub at carbon3.net/data/industries/ambition, with figures as of November 2026. It matches about 7,200 companies in 50 industries to the registry of the Science Based Targets initiative (SBTi), which checks corporate climate targets against climate science, and it looks at them three ways.
What the study measures
The study looks at Scope 1 and 2 emissions, the greenhouse gases from a company's own operations and from the energy it buys. It uses near-term targets, a company's goal for the next five to ten years, which the SBTi validates once it has checked the target.
The three views build on each other. The ambition map counts how many companies in each industry have a validated target. The promised pace reads each target and works out how fast it promises to cut. The first look at delivery compares that promise with the latest change in each company's reported emissions.
View 1: the ambition map
Across the whole Data Hub, 70% of companies on the SBTi registry have validated near-term targets, 27% have committed to set one and 3% had a commitment removed. Of the validated targets, 96% are aligned with 1.5°C. 27% of companies also have a validated net-zero target, and the median near-term target year is 2030.
The share with validated targets ranges from 48% in animal source food production to 93% in railroads, across the 35 industries with at least 30 companies each.
| Industry | Companies | Validated targets | Committed |
|---|---|---|---|
| Railroads | 43 | 93% | 7% |
| Telecommunication services | 151 | 89% | 9% |
| Media | 84 | 86% | 13% |
| Real estate | 211 | 85% | 13% |
| Agricultural production | 104 | 58% | 38% |
| Trucking | 113 | 53% | 40% |
| Animal source food production | 66 | 48% | 47% |
| All industries | 7,158 | 70% | 27% |
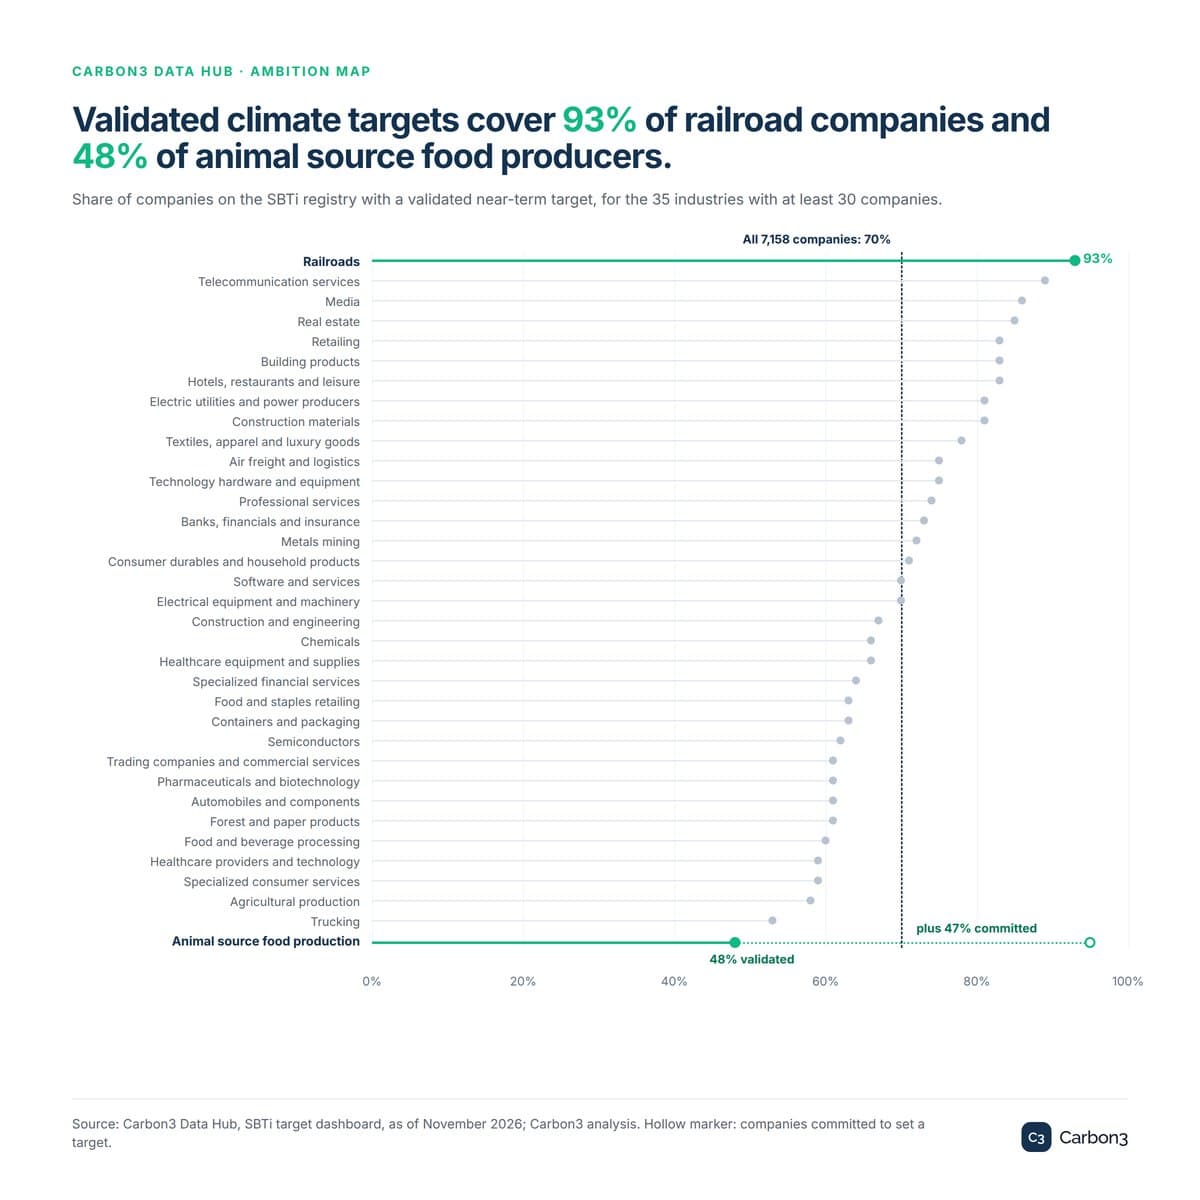
The bottom of the table may reflect timing as much as ambition. In animal source food production, nearly as many companies have committed to a target (47%) as have one validated (48%), and agricultural production and trucking show the same pattern on a smaller scale. A year of validations could change these rows considerably. For a food or logistics buyer, it means many suppliers have said they will set a target but do not yet have one checked.
View 2: the promised pace
The Data Hub can read an absolute Scope 1 and 2 target for about 4,300 companies, 86% of those with validated targets. Each one is stated as a percentage cut from a base year by a target year. A target of 42% less by 2030 than in 2020, spread evenly, is a cut of 4.2% of the base-year figure each year.
96% of these readable targets promise to cut at least 4.2% a year, and the median promise is 5.3% a year. That headline needs context. The SBTi asks for at least 4.2% a year for a target aligned with 1.5°C, so most validated targets clear that line by design. The more useful signal is the spread between industries.
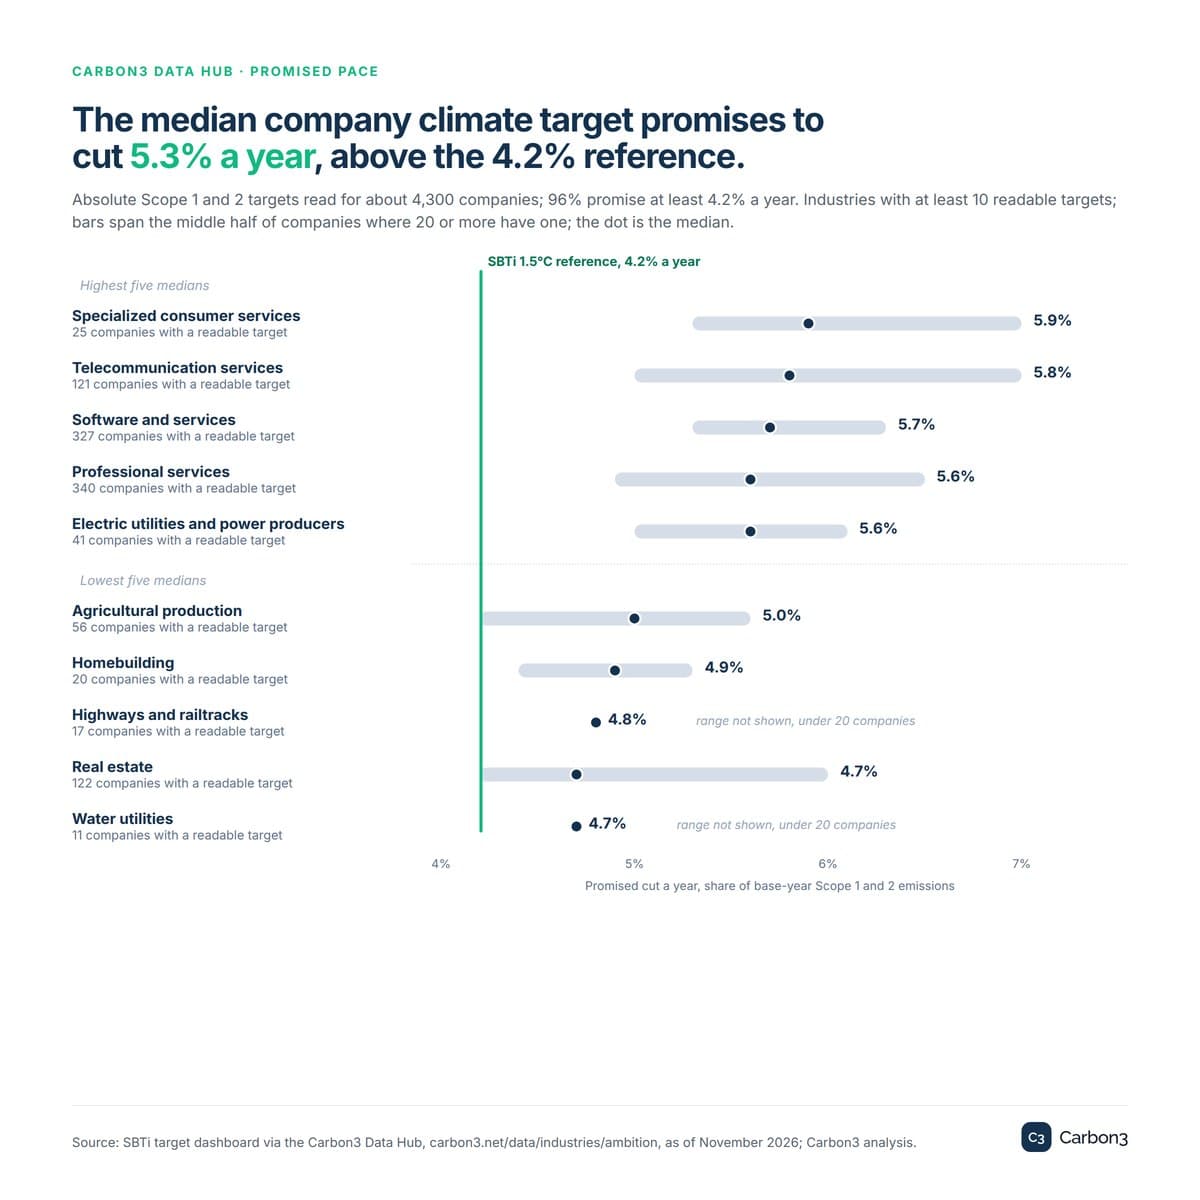
The median promise in every one of the 40 industries with at least 10 readable targets is above 4.2% a year. Specialized consumer services promise the steepest median, 5.9% a year across 25 companies, followed by telecommunication services at 5.8% and software and services at 5.7%. Real estate and water utilities sit lowest, both at a median of 4.7% a year. Within industries, some single promises go much further: the steepest building products target on the page is VELUX's 100% less by 2030 than in 2020, and among railroads it is Transport for London's 90% less by 2030 than in 2022.
View 3: target vs actual, a first look
586 companies have a readable target and also report Scope 1 and 2 emissions for two recent years inside their target period, with the later year between 2023 and 2026. For each, the study compares the latest change with the pace its target needs each year.
Of the 586, 295 cut at or above their promised pace, which is 50%. A further 93 reduced their emissions, but more slowly than promised, and 198 reported a rise. The story that many targets are on track is real, and so is the story that a large group of companies is moving the wrong way.
Industries differ widely. The table shows every industry with at least 10 companies compared.
| Industry | Compared | At or above pace | Slower | Rising |
|---|---|---|---|---|
| Software and services | 54 | 34 | 5 | 15 |
| Pharmaceuticals and biotechnology | 48 | 31 | 6 | 11 |
| Electrical equipment and machinery | 41 | 23 | 8 | 10 |
| Professional services | 36 | 20 | 6 | 10 |
| Food and beverage processing | 31 | 14 | 5 | 12 |
| Technology hardware and equipment | 31 | 18 | 6 | 7 |
| Textiles, apparel and luxury goods | 30 | 8 | 6 | 16 |
| Telecommunication services | 25 | 13 | 6 | 6 |
| Semiconductors | 23 | 11 | 5 | 7 |
| Retailing | 22 | 9 | 4 | 9 |
| Consumer durables and household products | 21 | 8 | 6 | 7 |
| Hotels, restaurants and leisure | 21 | 4 | 6 | 11 |
| Construction and engineering | 17 | 11 | 1 | 5 |
| Healthcare equipment and supplies | 17 | 10 | 2 | 5 |
| Chemicals | 16 | 7 | 2 | 7 |
| Real estate | 16 | 9 | 1 | 6 |
| Automobiles and components | 15 | 8 | 3 | 4 |
| Healthcare providers and technology | 13 | 5 | 2 | 6 |
| Forest and paper products | 12 | 7 | 1 | 4 |
| Trading companies and commercial services | 12 | 4 | 2 | 6 |
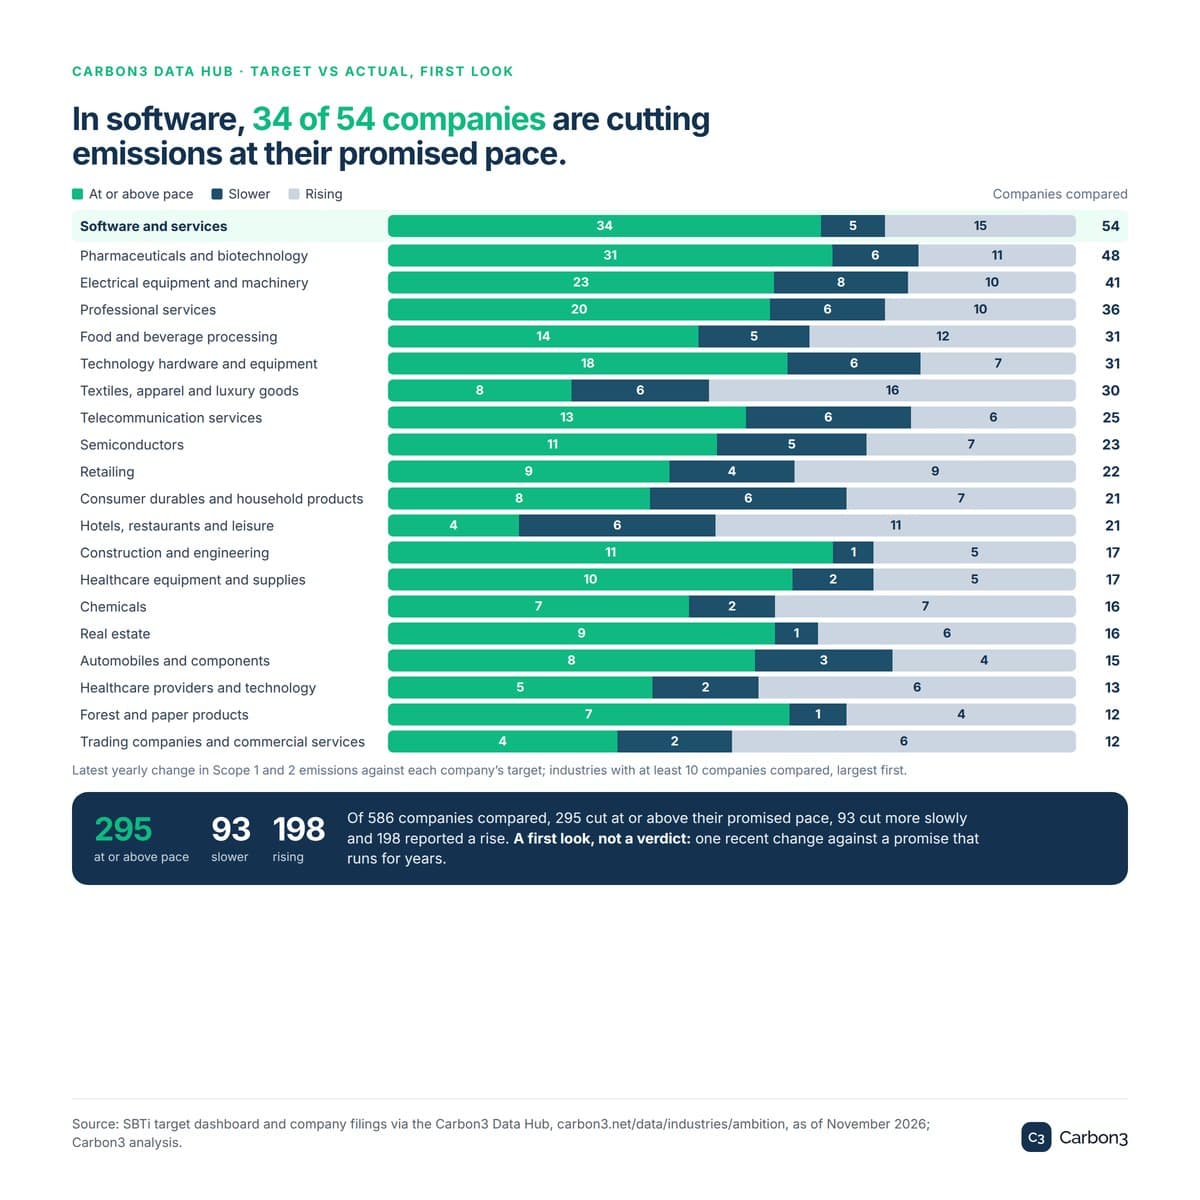
In software and services, the largest group compared, 34 of 54 companies are on pace, and in pharmaceuticals and biotechnology 31 of 48. In construction and engineering, 11 of 17 are on pace. At the other end, 16 of 30 textiles, apparel and luxury goods companies and 11 of 21 hotel, restaurant and leisure companies reported a rise. Most industry rows hold fewer than 30 companies, so a handful of reports can move them.
What it means for buyers
One company's Scope 1 and 2 emissions are part of its customers' Scope 3, the emissions in their value chain. When a supplier is on pace, its buyers' Scope 3 tends to fall with it. When a supplier's emissions rise, the buyer's own target gets harder, whatever the supplier promised.
That makes delivery data a procurement question as much as a reporting one. A buyer can see which suppliers are on pace and which need help, and can choose where to co-finance emissions reductions. Insetting, which means financing emissions reductions in a company's own value chain, is one way to do that.
Method and limits
- Industry is the sector of each company's primary record on the SBTi registry. The ambition map lists industries with at least 30 companies, and a 1.5°C share and a median target year appear once 10 companies in a row have validated targets.
- The promised pace reads the wording of each validated near-term target. Only absolute targets that cover Scope 1 and 2 together are read. Intensity targets, targets for Scope 1 or Scope 2 alone, and targets that pool Scope 1, 2 and 3 into one figure are left out rather than guessed.
- Hand checks of 300 randomly chosen targets against the SBTi wording found no reading errors. The check covers how target wording was read, not the reported emissions.
- The first look compares a company's latest Scope 1 and 2 figure with its previous one, up to three years earlier, as a compound yearly rate. Both years must fall inside the target period, and an industry row needs 10 companies compared.
- It sets one recent change against a promise that runs for years. A single year can swing with weather, an acquisition or a change in how a company counts.
- The target is a straight-line share of the base-year figure, which is often not on file, while the change compares two reported years.
- The 586 companies are those that publish two recent years of emissions and have a readable target, so they may not represent every company with a target.
- Company pages that Carbon3 prepared ahead of a claim, and demonstration accounts, are left out. A missing figure is left out, never counted as zero, and nothing is estimated.
- The view updates on its own as more reported years reach the Data Hub, so figures here are as of November 2026.
Explore the data
Every industry, every promised pace and the full first look are free to explore at carbon3.net/data/industries/ambition. Each figure links to its company filing on the company page, and the peer benchmark sets any company beside its industry. Questions about the data, or an industry to look at more closely, are welcome through Contact us.
Sources
- Carbon3 Data Hub, Climate targets by industry: SBTi ambition and promised pace, figures as of November 2026, accessed 11 November 2026; Carbon3 analysis.
- Science Based Targets initiative, target dashboard, via the Carbon3 Data Hub, as of November 2026.
- Company filings via the Carbon3 emissions registry, carbon3.net/data/emissions, accessed 11 November 2026.
Learn more
How a buyer reports inset credits
Read more from the research team.
Claims & reporting
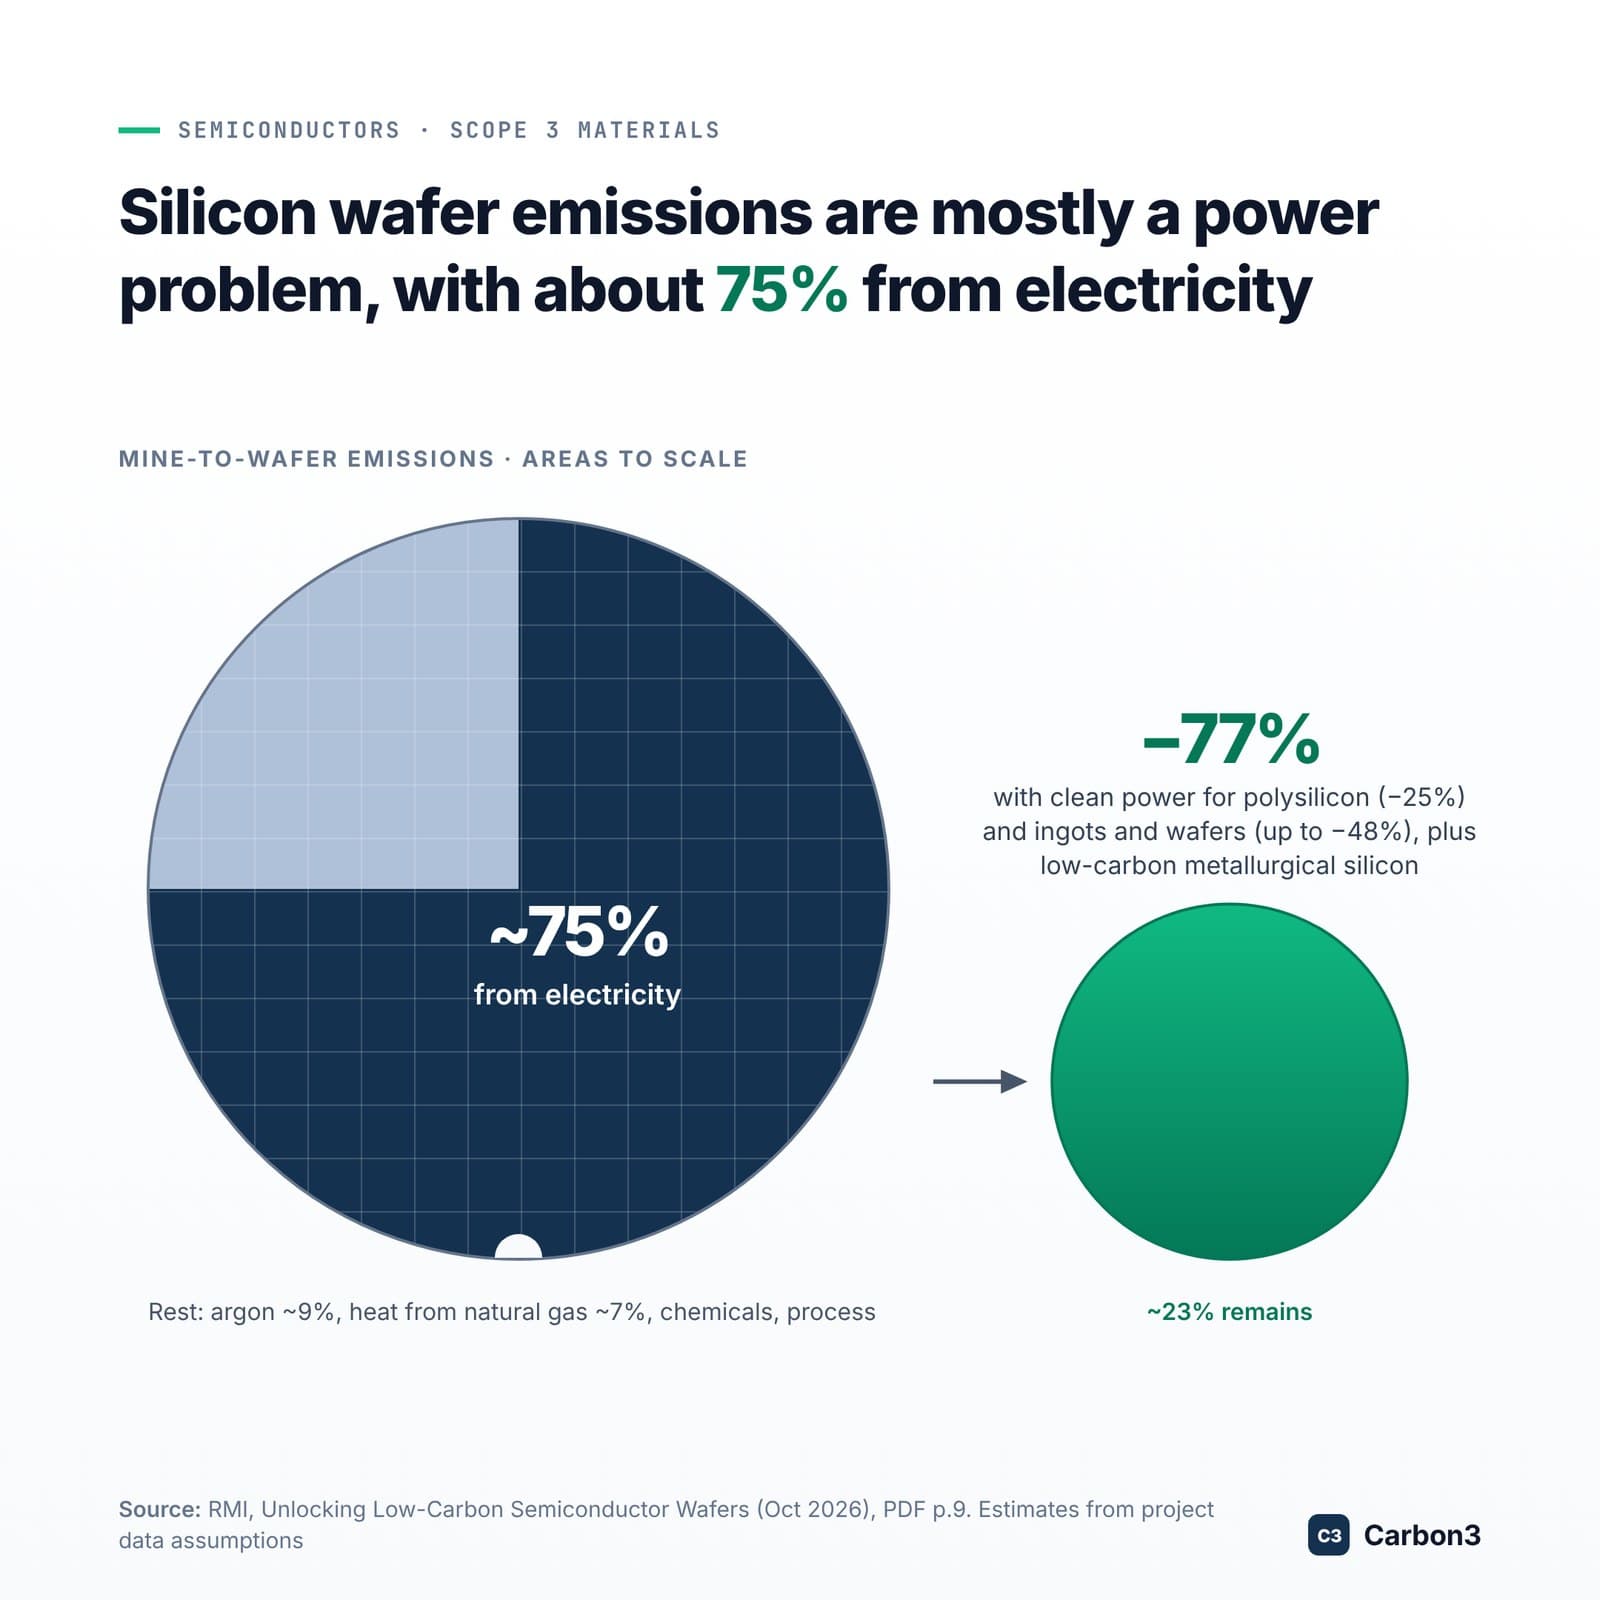
Silicon wafer emissions are mostly a power problem, with about 75% from electricity
RMI's work with Hemlock, SEH America, Micron and Microsoft finds that clean power and low-carbon silicon could reduce mine-to-wafer emissions by an estimated 77%.
Read the articleClaims & reporting
GHG Protocol AMI is insetting in a new reporting shell
GHG Protocol AMI: Carbon3 on the Actions and Market Instruments Standard, a multi-statement GHG report, and a market-based Scope 3 inventory.
Read the articleIntegrity
Half of the 558 companies checked are reducing emissions at the pace their targets promise
Carbon3's first look at whether climate targets are being delivered compares validated Scope 1 and 2 targets with two recent reported years.
Read the article
See the companies behind these figures in the Data Hub.
Look up your suppliers’ emissions and targets, free.