Maersk and Hapag-Lloyd differ in size, but their footprints share the same shape
Maersk reported about 2.2 times Hapag-Lloyd's Scope 1 and 2 emissions in 2024, yet Scope 3 makes up 59% and 58% of their reported footprints.
By Carbon3 team2 min read
Two of the world's largest container carriers differ greatly in size, yet their climate footprints have almost the same shape, according to the Carbon3 Data Hub company comparison, which draws on each company's 2024 emissions filing.
Different scale in their own operations
In 2024, A.P. Moller - Maersk reported 34,295,000 tCO₂e from its own operations and the energy it buys (Scope 1 and 2), while Hapag-Lloyd reported 15,301,000 tCO₂e. That means Maersk's own operations carried about 2.2 times the emissions of Hapag-Lloyd's.
The same share sits in the value chain
The picture changes once Scope 3 is included. Scope 3 covers the emissions across a company's wider value chain, such as the fuel it buys before it reaches the ship, the vessels and equipment it purchases, and the partners it works with. For Maersk, Scope 3 makes up 59% of its reported footprint, and for Hapag-Lloyd it makes up 58%.
So although one company is about twice the size of the other in its own operations, both report that close to three-fifths of their climate footprint sits outside the parts they run directly.
Who shares the cost of reducing it
That shape matters for anyone planning emissions reductions in shipping. A carrier can change its own fleet, but the larger part of its footprint depends on fuel producers, shipyards and other suppliers. The same is true in the other direction, because a carrier's own emissions show up in the Scope 3 footprints of the cargo owners who ship with it.
When most of the footprint sits in the value chain, no single company can reduce it alone. Fuel suppliers, carriers and cargo owners each hold part of the solution and part of the cost, and each reduction they fund together should be traceable and claimed only once. Carbon3 explains how reductions inside a value chain differ from offsets outside it on its insets vs offsets page.
Readers can compare the two carriers directly, or any other pair of companies, in the Carbon3 Data Hub.
If most of a carrier's footprint sits in its value chain, who should share the cost of reducing it?
Learn more
How insetting works in shipping
Originally published on LinkedIn, 10 November 2026.
Read more from the research team.
Sector: Maritime
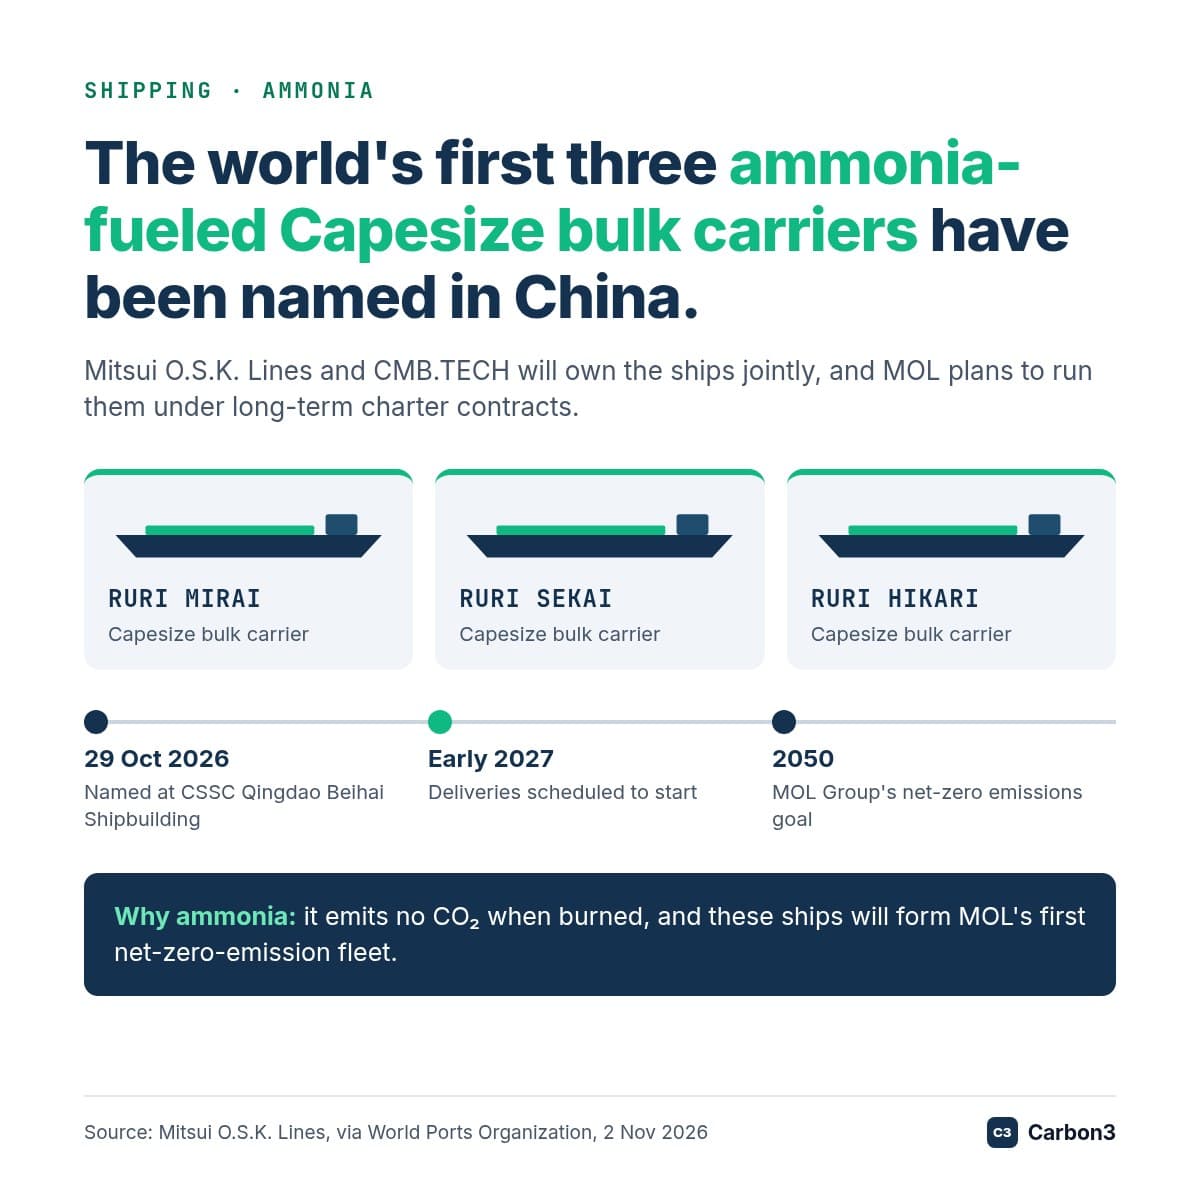
The first three ammonia-fueled Capesize bulk carriers have been named in China
Mitsui O.S.K.
Read the articleSector: Maritime
FuelEU Maritime only works if someone can pay the green premium
FuelEU Maritime asks ships calling at EU ports to cut the greenhouse gas intensity of their fuel 2% from 2025, rising to 80% by 2050.
Read the articleSector: Aviation
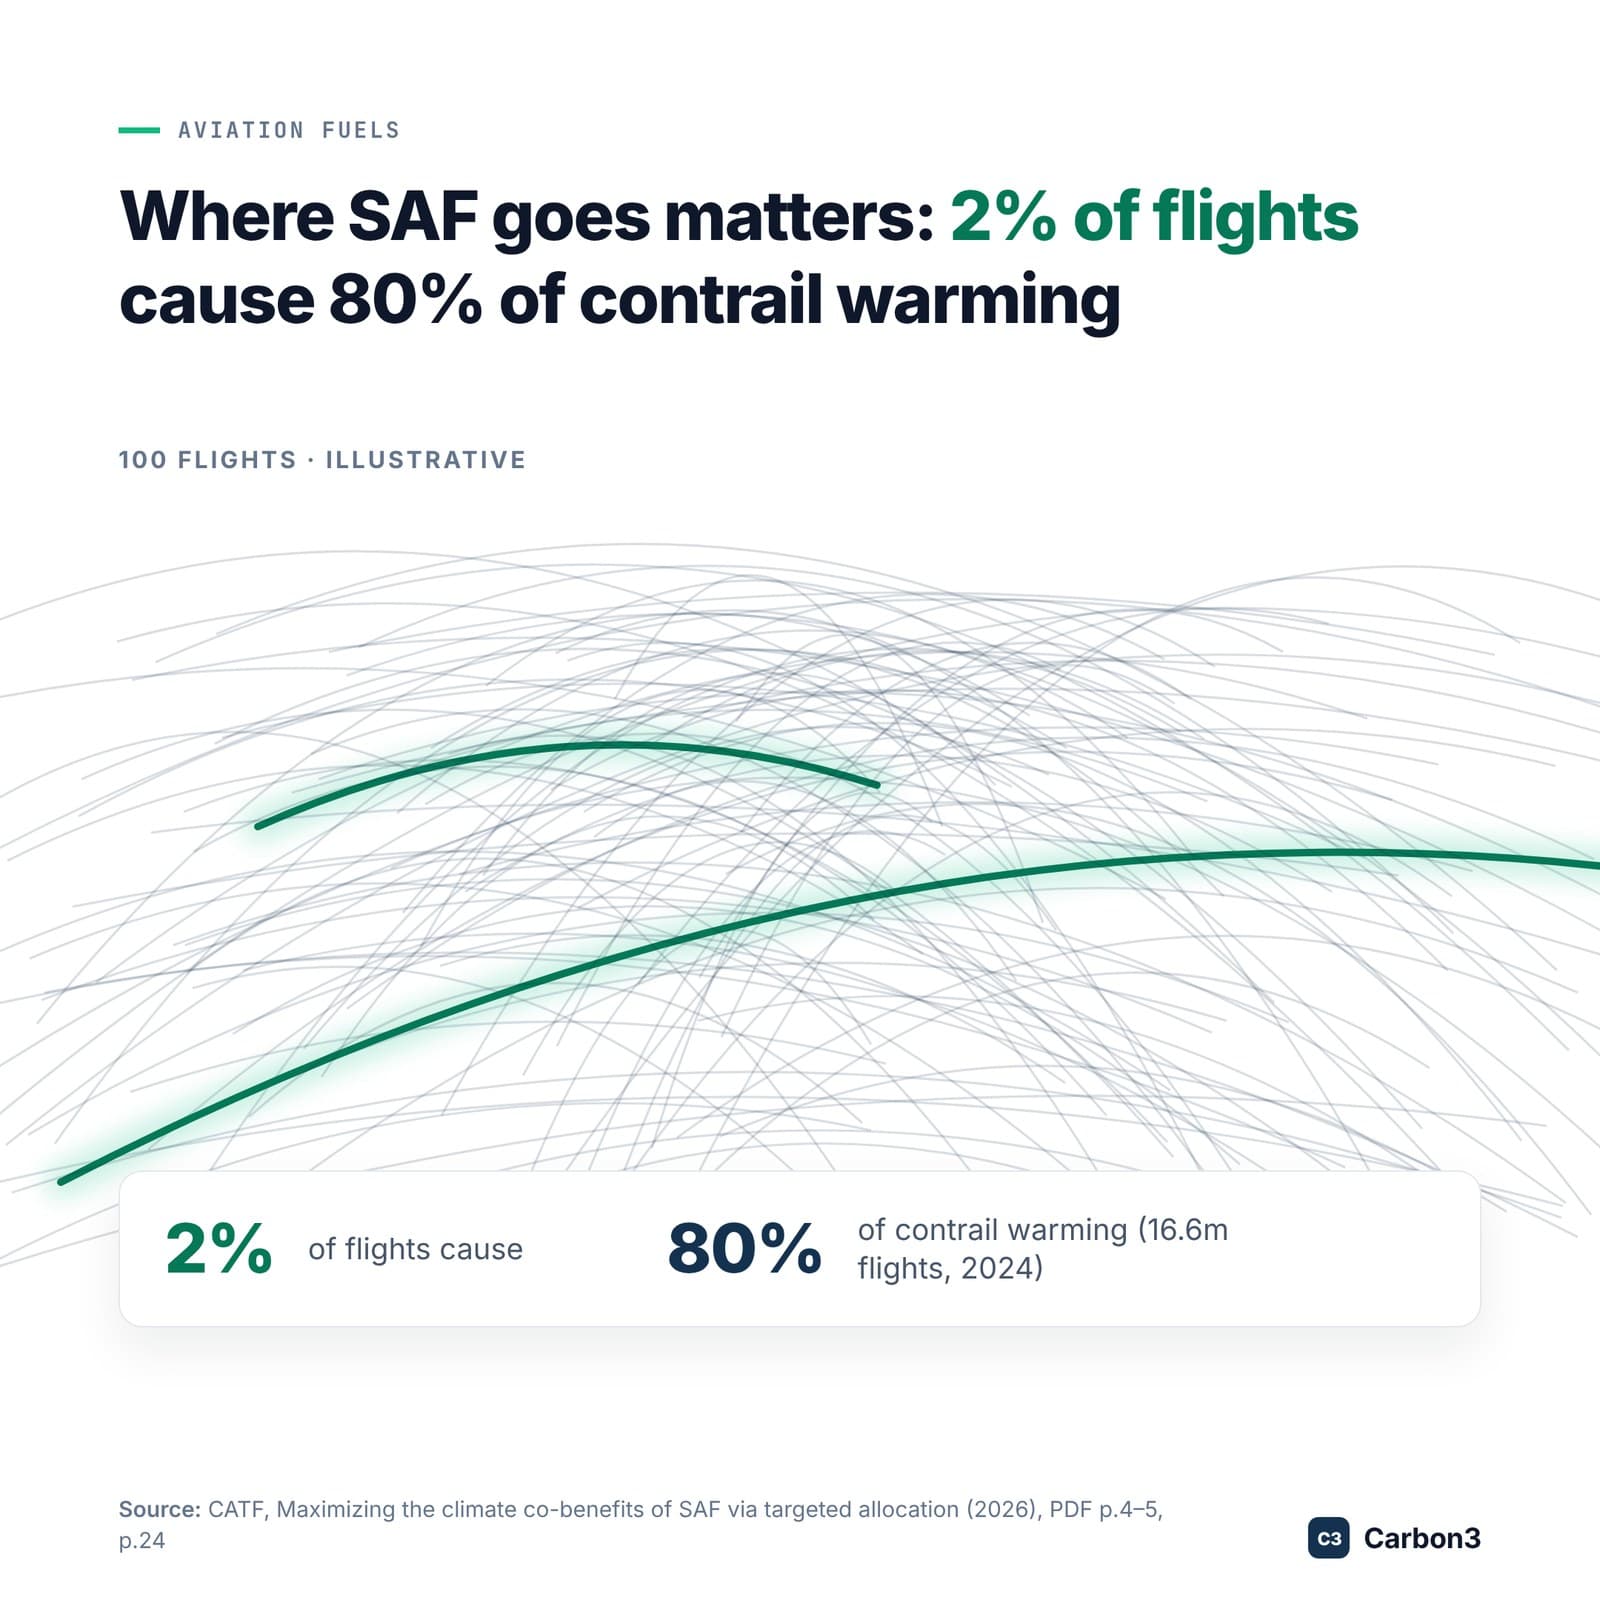
Not every liter of sustainable aviation fuel does the same climate work
Clean Air Task Force finds about 2% of flights cause 80% of contrail-related warming, which makes where scarce SAF is burned, and how it is traced, matter for Scope 3 buyers.
Read the article
See the companies behind these figures in the Data Hub.
Look up your suppliers’ emissions and targets, free.